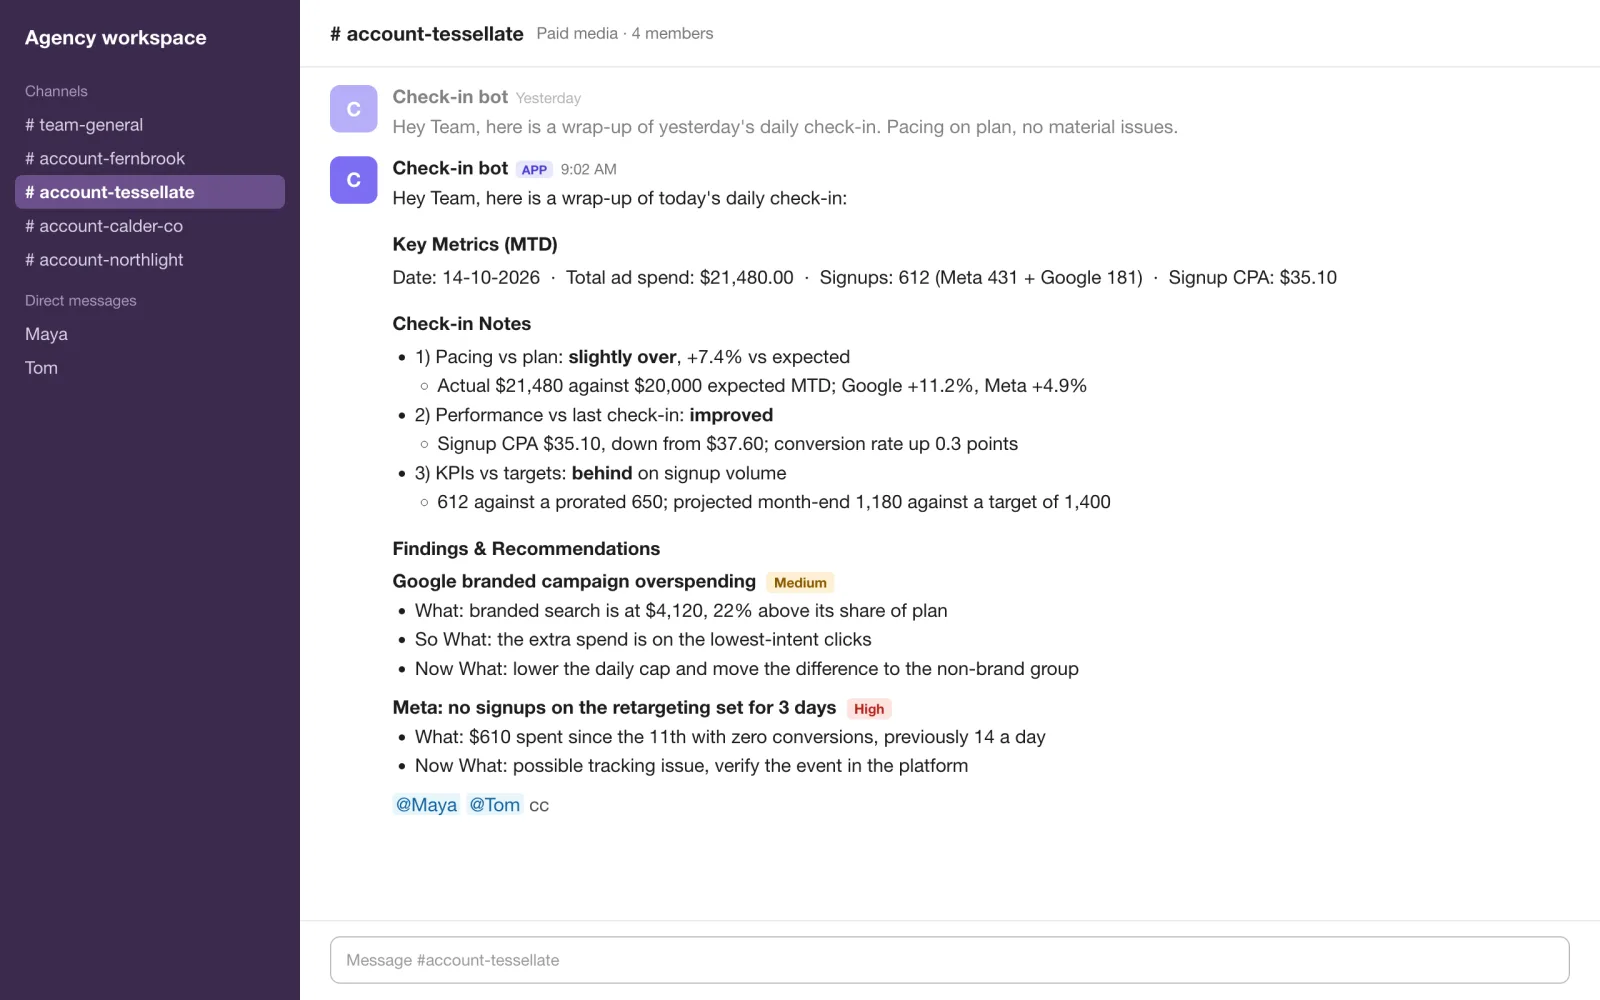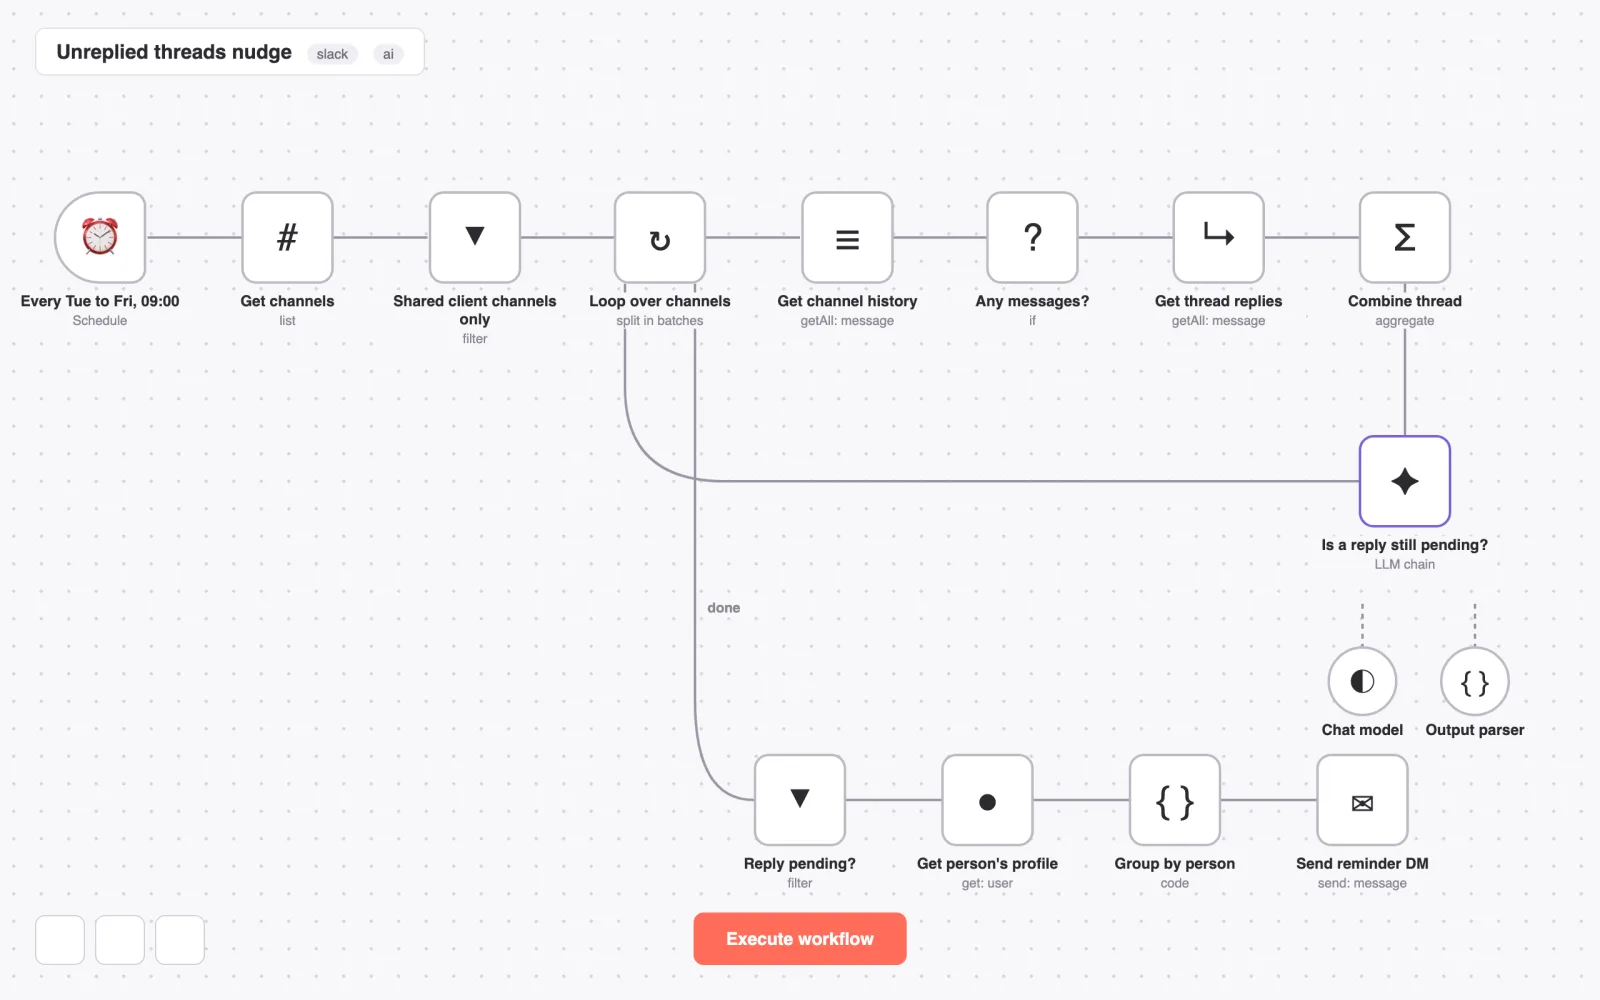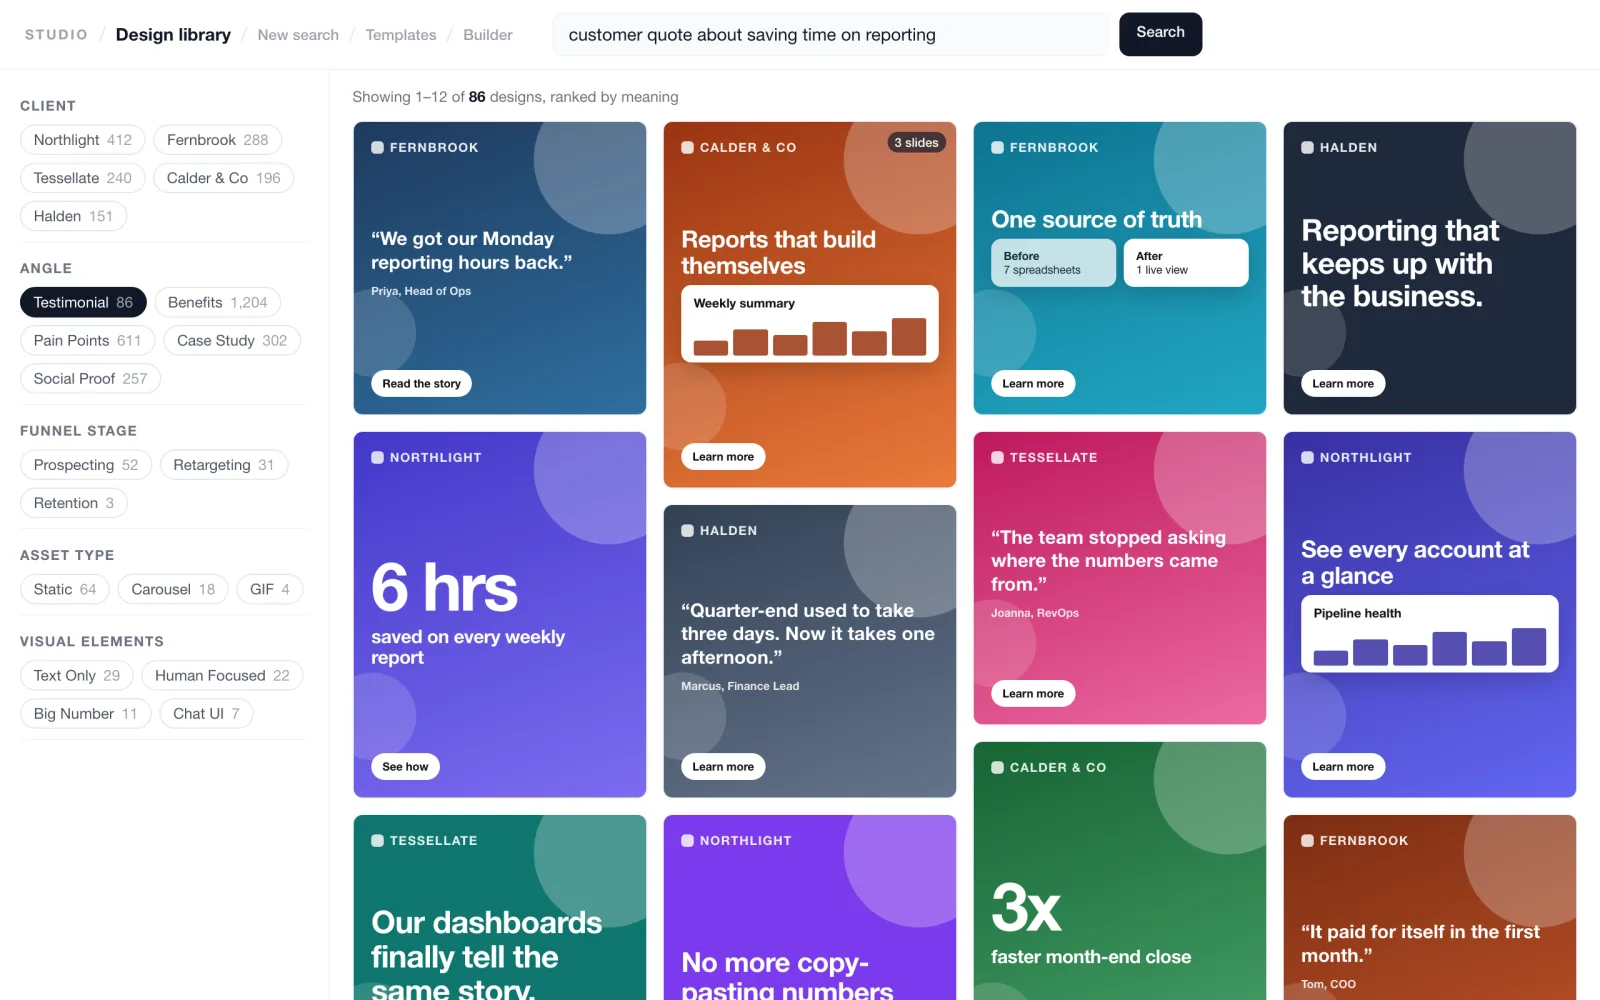
Past creative, found with one plain-English search.
129client folders migrated
21,065designs in the library
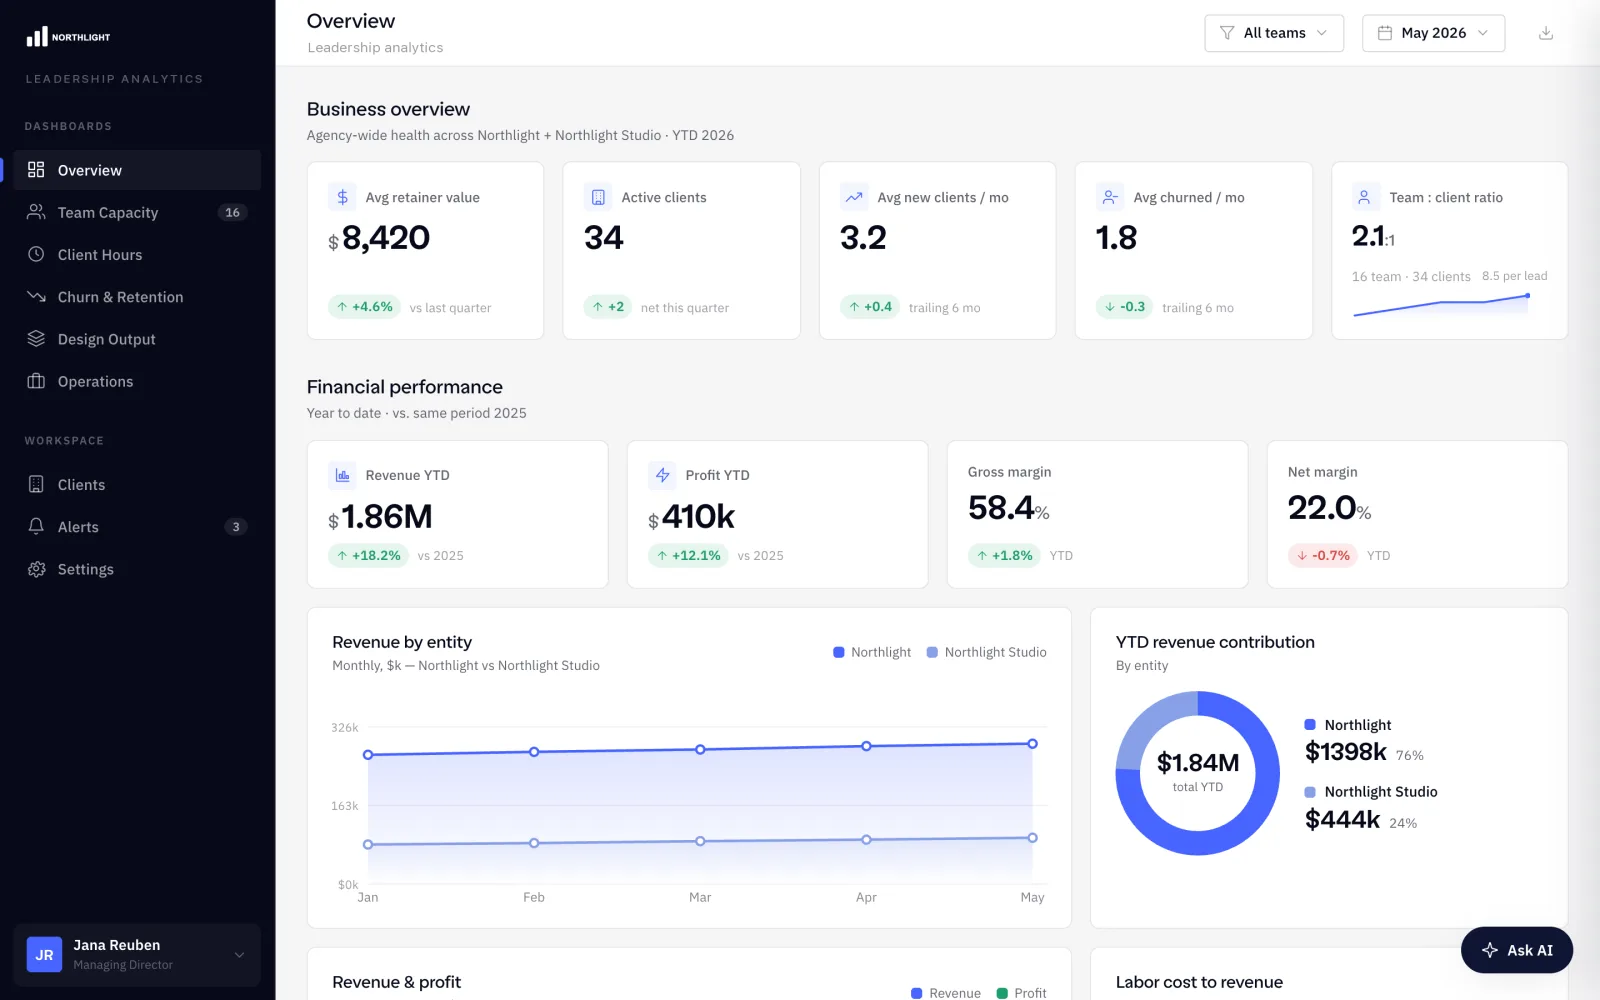
Leadership reviews capacity, delivery, churn and margin in one place, instead of debating which department spreadsheet is right.
Leadership had no single source of truth for clients, capacity, delivery, churn or margin. Metrics lived in department spreadsheets and differed depending on who prepared them. In one instance, inserting a column corrupted 352 cells without anyone noticing.
Yash built a shared Postgres warehouse, 16 dashboard screens and two API routes. Time tracking, tasks, the absence calendar, the HR roster, subscription invoices, Slack-sourced sentiment and finance sheets flow into the same model through scheduled sync jobs. Purpose-built aggregation queries define each metric. An AI analyst reads those metrics through tools, with read-only SQL enforced in the database. A sync-health view flags any feed that goes stale and posts an alert to Slack.
| Area | Before | After |
|---|---|---|
| Reporting | Per-department spreadsheets | 16 connected dashboard screens |
| Metric confidence | Silent formula breakage | Verification scripts and legacy-figure checks |
| Data freshness | Nobody knew a feed had stopped | Stale feeds flagged and alerted in Slack |
| AI answers | Risk of a second set of numbers | The same datasets as the dashboard |
Weekly leadership reviews run on the platform instead of the spreadsheet. After the time-entry clean-up, the table held 291,550 rows with zero duplicate IDs. A later audit found no ID collisions across 304,719 rows, and ingestion was checked against the source API before it was relied on.
Weekly leadership reviews now run on the platform. Metrics were reconciled against the legacy spreadsheets before the switch, and the time-entry table was verified for duplicate and colliding IDs. Reporting-time and revenue gains were not measured.
The useful part of a dashboard is the definition behind the number. Contract values are normalised by payment frequency, client names are matched through one shared key, and data-quality caveats are shown in the interface. The AI’s database access is enforced as read-only in Postgres, and 42 automated test files cover the metric, sync and AI logic. Part of the client-request reporting began life as a small standalone dashboard, and its logic was later ported into this platform.
Production interface with the portfolio’s illustrative “Northlight” dataset. Company names and financial figures shown are fictional.
If your leadership meeting starts by debating which spreadsheet is right, a shared, verified reporting layer can change the conversation.